Introduction
Versus.com is a website that provides services on comparing various aspects of life, from tech-devices, foods, to universities and football teams.
One of the most popular searches on this site is city facts and comparisons between cities around the world.
This City dataset is obtained from scraping Versus.com. Without that website, this dataset wouldn’t have existed.
Format
1 csv file with 356 rows and 66 columns.
Download
Download from my public repository here (removed per request from versus.com).
Demonstrations
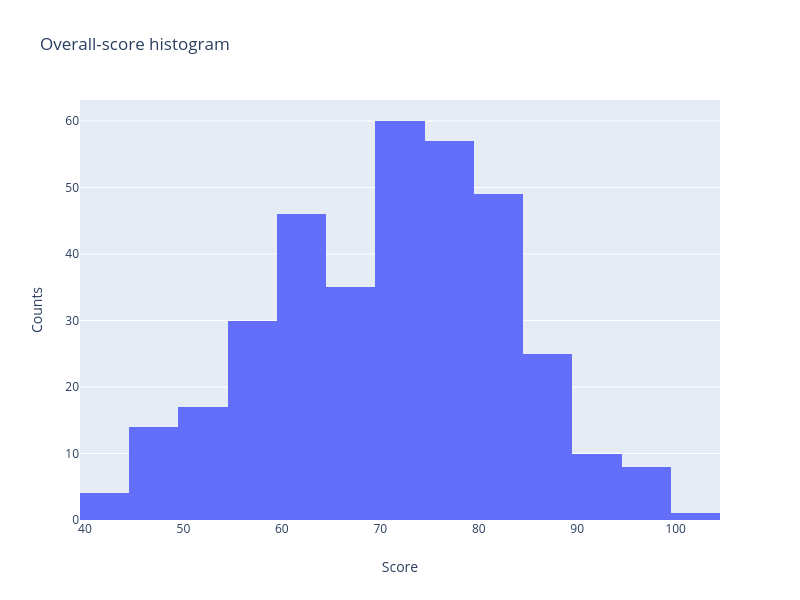
The distribution of overall-scores:

City population follows an exponential distribution:

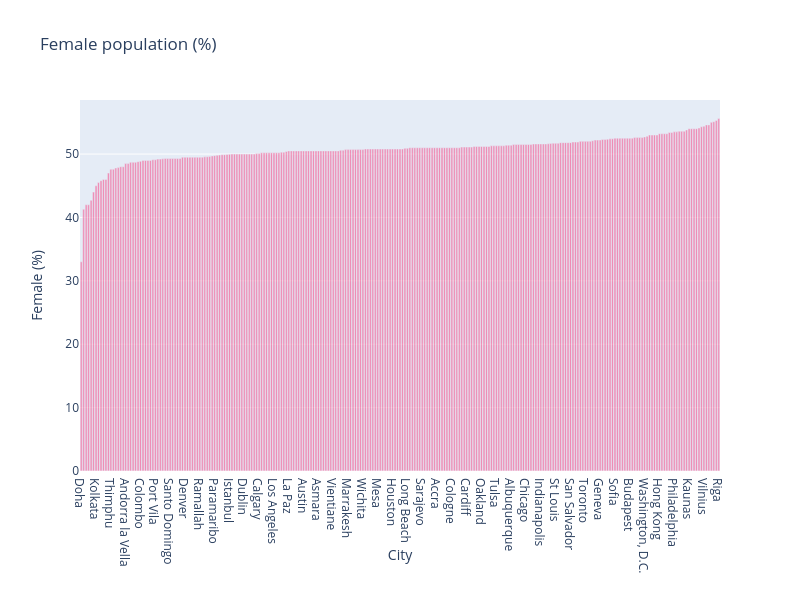
The ratio of female in the population of cities: over the cities in this list, Doha is the one with the smallest ratio of female population, only 1 over 3 people here is female.

The unemployment rate in the interaction with Average salary: cities with a higher average paid seems to have more stable unemployment rates.

The annual population growth rate and the median age of population: they give a Pearson correlation of -0.26.

Column description
id | an unique identifier for each city.
name | city name.
overall_score | The Versus score measures the overall performance, on a scale from 1 to 100. The score is calculated taking into account all properties, giving a higher weight to the properties that Versus’s users vote for as highly relevant.
single_population | Bigger single population indicates that living alone in the city is easier and more affordable. It’s also usually connected with better nightlife and dating possibilities. Source: Wikipedia, 2020; city’s official stats, 2020.
number_of_theaters | Source: Wikipedia, 2020; city’s official website, 2020.
international_population | More people from abroad residing in the city provides a multicultural environment and may show how attractive it is for foreigners.
murder_rate | Murder rate expresses the number of murders per 100,000 inhabitants. Lower murder rate indicates a safer city and a better quality of living. Source: Wikipedia, 2020.
population_density | Population density shows how cramped or spread out inhabitants are. Cities or countries with high population densities can be considered overpopulated, but this becomes an issue if the infrastructure is underdeveloped. Source: Wikipedia, 2020.
football_clubs_in_the_top_division | Having a well-known football team playing in a country’s first division shows a big interest of the city in sport and attracts visitors to events such as big matches.
median_age_of_population | Cities or countries with the younger population have usually better development perspectives. Young societies are more dynamic and creative. Source: Wikipedia, 2020.
median_household_income | Source: UN HABITAT, 2020; city’s official stats, 2020.
population | Populous cities or countries usually offer better employment opportunities because of their large economies. Big cities attract companies and business investment, and are usually important cultural centers and research hubs. Source: Wikipedia, 2020.
annual_population_growth_rate | The average population growth rate reflects the annual increase or decrease in population. Currently, the world’s population is growing at a rate of approximately 1.07% per year. The higher the growth, the more dynamic society feels. Source: Wikipedia, 2020.
female_population | The percentage of female residents, according to the city’s official statistics. Source: Wikipedia, 2020; UNData, 2020.
average_price_of_a_beer__0_5_l | The average price of a bottle of beer (0.5 l). The average price is calculated for locally produced beers sold in shops/supermarkets. Source: numbeo.com, 2020
male_population | The percentage of male residents, according to the city’s official statistics. Source: Wikipedia, 2020; UNData, 2020.
cost_of_a_one_bedroom_apartment_in_the_city_center | The average price of a single-bedroom apartment located in the city center shows how much of your salary would be allocated in rent expenses, and is an indicator of the cost of living of the city. Source: numbeo.com, 2020.
length_of_subway_per_100_000_inhabitants | The subway rate or the number of kilometers of subway per number of inhabitants indicates how well developed the subway network is. Source: Wikipedia, 2020.
average_salary | Source: Wikipedia, 2020; city’s official stats, 2020.
percentage_of_slum_population | The size of the slum population indicates the presence of big social inequalities in a city. Source: UN HABITAT, 2020.
income_inequalities | The Gini coefficient is a measure of dispersion, in this case, used to show the variation in income. A Gini coefficient of zero expresses perfect equality. A Gini coefficient of one expresses maximal inequality. Lower-income inequalities indicate a more equal distribution of wealth and better opportunities for the average citizen. Source: Wikipedia, 2020.
level_of_air_pollution__air_quality_index | Low level of air pollution has a good influence on people’s health and quality of living. Source: Wikipedia, 2020.
gross_domestic_product__gdp | The Gross Domestic Product (GDP) reflects the value and productivity of an economy. It measures the market value of all the final goods and services produced annually. To reflect the differences in the cost of living and inflation rates, we show the GDP at purchasing power parity (PPP). Sources: Wikipedia, CIA World Factbook, 2020.
total_surface | It can be nice to live in big cities or countries, as a larger space may offer more options for residents and visitors.
number_of_public_wi_fi_spots | City with more public wireless spots provides easier and wider internet access. Source: city’s official website, 2020.
unemployment_rate | Low unemployment rate indicates better career opportunities and economic growth. Source: Wikipedia, 2020; city’s official stats, 2020.
average_price_of_milk__1_liter | The prices of highly demanded consumer goods can help estimate the average cost of groceries and the overall cost of living in the city. A lower average price for one liter of milk may indicate that the city is less expensive compared to other cities. Source: numbeo.com, 2020.
income_growth | Income growth indicates how fast the city develops and improves living conditions within it. Source: UN HABITAT, 2020; city’s official stats, 2020.
average_commuting_time | Cities with shorter average commuting time have usually better organized public transportation systems which allow citizens to waste less time in traffic. Source: Wikipedia, 2020; city’s official stats, 2020.
vat | The standard value-added tax (VAT) rate. Source: Wikipedia, 2020.
number_of_sister_cities | Sister cities or twin towns are a form of law agreement made between towns, cities, or regions in politically distinct areas to promote cultural and commercial ties. It might mean more possibilities outside your city, greater multiculturalism, and a wider range of options.
facebook_users | The percentage of Facebook users among a whole city population indicates how familiar are the city’s inhabitants with web 2.0 and shows how popular social media are. Source: Socialbakers, 2020.
number_of_universities | Universities, as centers of higher education and research, are important contributions to a city’s development. Source: Wikipedia, 2020.
maximum_income_tax | Source: Wikipedia, 2020.
commuter_pain_index | The Commuter Pain Index is comprised of 10 issues: 1) commuting time, 2) time stuck in traffic, an agreement that: 3) price of gas is already too high, 4) traffic has gotten worse, 5) start-‐stop traffic is a problem, 6) driving causes stress, 7) driving causes anger, 8) traffic affects work, 9) traffic so bad driving stopped, and 10) decided not to make trips due to traffic. Source: IBM, 2020.
big_mac_index | The Big Mac Index is published by The Economist as an informal way of measuring the purchasing power parity (PPP) between two currencies. The Big Mac PPP exchange rate between two countries is obtained by dividing the price of a Big Mac in one country (in its currency) by the price of a Big Mac in another country (in its currency). Source: Economist, 2020.
mcdonald_s_mcmeal_or_combo_meal_price | Analyzing the price variations for the same product in different markets is a way of measuring the purchasing power parity and the strength of different currencies.
fuel_price__1_liter | The prices of highly demanded consumer goods can help estimate the overall cost of living in the city. A lower average price for one liter of fuel is especially important for residents who drive daily around the city. Source: numbeo.com, 2020.
total_length_of_bike_paths | More bike paths gives more opportunities for cyclists, makes a city more eco friendly, and helps to reduce traffic jams. Source: Wikipedia, 2020.
number_of_kindergartens | Bigger number of kindergartens makes it easier to combine career opportunities with bringing up a child. Source: city’s official stats, 2020.
hospital_beds_per_1_000_inhabitants | Countries or cities with a higher number of hospital beds per 1,000 inhabitants usually have well-developed health care systems. Source: , 2020
number_of_international_embassies | The number of international embassies indicates the importance of a city for political, diplomatic, and lobbying issues. Source: city’s official website, 2020.
quality_of_living | The annual survey ranks 221 cities using 39 criteria. Important criteria are safety, education, hygiene, healthcare, culture, environment, recreation, political-economic stability, and public transport. Source: Mercer, 2020.
minimum_income_tax | Source: Wikipedia, 2020.
position_in__the_world_s_best_city_to_live_in__ranking | This ranking made by Condé Nast Traveler is based on readers’ opinions. A higher position means that the city is considered as a better place to live. Source: Condé Nast Magazine, 2020.
number_of_international_organizations__headquarters | The number of international organizations indicates the international importance of a city. Source: Wikipedia, 2020.
average_temperature | Source: Wikipedia, 2020; WMO, 2020.
number_of_cinemas | Source: Wikipedia, 2020; city’s official website, 2020.
distance_from_capital | A city located near to the country capital may provide more possibilities. Some people love to visit or live in a quiet city, but also want to enjoy the variety of entertainment options or job opportunities that a capital city may offer.
average_maximum_temperature | Source: Wikipedia, 2020; WMO, 2020.
green_area_per_person | More m² of green areas per person indicates that a city has more green areas like parks, forests, etc. in its administrative borders which makes the city more inhabitants friendly. Source: WHO, 2020.
number_of_tourists_per_year | More arrivals per year shows how important the city is viewed internationally, and may indicate better infrastructure, such as airports, public transport, hotels, etc. Tourism is usually a major source of income of a city. Source: World Tourism Organization, 2020.
humidity_rate | Humidity is the amount of water vapor in the air. High relative humidity reduces the effectiveness of sweating in cooling the body by reducing the rate of evaporation of moisture from the skin. In general, higher humidity makes the climate harder to stand for people. Source: Wikipedia, 2020; WMO, 2020.
theft_rate | Theft rate expresses the number of thefts per 100,000 inhabitants. Lower thefts rate indicates a safer city and a better quality of living. Source: Wikipedia, 2020.
average_minimum_temperature | Source: Wikipedia, 2020; WMO, 2020.
unesco_world_heritage_landmarks | The World Heritage List includes 962 properties forming part of the cultural and natural heritage which the World Heritage Committee considers as having outstanding universal value. Source: UNESCO, 2020.
number_of_museums | Source: Wikipedia, 2020; city’s official website, 2020.
sports_facilities__stadiums__arenas_with_20_000__seats | With more large sports facilities (20,000+ seats), a city is able to organize more important sporting events. Source: worldstadiums.com, 2020.
research_institutions_and_think_tanks | A think tank (or policy institute) is an organization that conducts research and engages in advocacy in areas such as social policy, political strategy, economics, military, technology issues, and in the creative and cultural field. The number of important think tanks can indicate the innovativeness and competitiveness of a city. Source: Brookings, 2020.
cost_of_the_monthly_public_transport_ticket | Cost of the monthly public transport ticket indicates the affordability of public transportation for an average inhabitant. Source: Wikipedia, 2020; city’s public transport website, 2020.
foreign_direct_investment__fdi | The presence of foreign direct investments (FDI) in a city shows its attractiveness for international business. Source: Wikipedia, 2020.
price_of_a_single_transportation_ticket | A cheaper single ticket will allow you to move through the city for less money. Whether you are a visitor or a resident, it will help your economy. Source: Official city’s public transport website, 2020.
number_of_airports | The presence and number of airports shows how good is the connection of the city with different international destinations and its international accessibility. Source: Wikipedia, 2020.
global_cities_index | The Global Cities Index is unique in that it measures the global engagement of cities across five dimensions: business activity, human capital, information exchange, cultural experience, and political engagement. Source: ATKearney, 2020.
number_of_billionaires | Number of billionaires can indicate if the city has significant agglomerations of personal wealth. Source: Forbes, 2020.
hospitals | The number of hospitals.