
| Test your knowledge |
|
|
Greetings!
Welcome to my series of blogs about Logistic Regression!
In this series, we will, step by step, explore the nature of one of the most popular predictive models for classification, including what it is, how it works, theory and practical guides, the requirements for using, advantages and disadvantages.
In this first blog, let me show you some of the basics even a layman should know about Logistic Regression.

What is Logistic Regression?
Logistic Regression is a fundamental brick of classification algorithms. To predict the label of a sample point, it computes a linear addition of the features (just like Linear Regression), this value is then being applied a Logistic function on (this is the part that differentiates it from Linear Regression), hence the name Logistic Regression.
Before digging into what a Logistic function is, let us take a review about the importance of Logistic Regression in our science.
The fact is, if anyone attempts to work on deriving knowledge from data, it is almost certain he will come across Logistic Regression, whatever path he chooses to go and whatever his goal is. We assume there are 3 typical roads for a newcomer to begin his journey into the world of data, those are Statistics, “traditional” Machine Learning (the one that involves conventional ML algorithms) and “modern” Deep Learning.
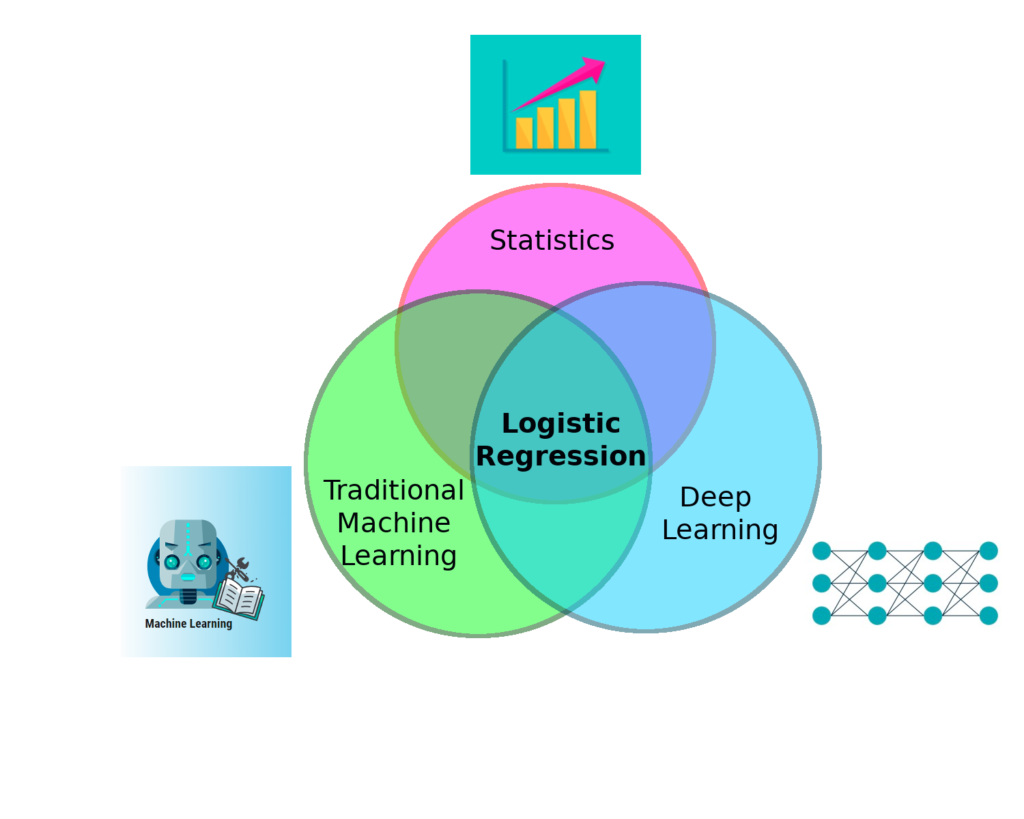
From the above arguments, we conclude that Logistic Regression is a must-learn algorithm that we cannot avoid. It is important, so let’s get to know it, now!
Notice that in this introductory blog, we adopt this Logistic Regression for binary classification, that is the cases when there are 2 labels that data sample can be marked, instead of multi-classification when there may be any finite number of classes. An example of binary classification is spam email filtering (an email can be marked as 0 – meaning not spam or 1 – meaning spam) while recognizing hand-written digits is a task of multi-classification (10 possible digits, from 0 to 9).
How does it work?
Recall from our last series about Linear Regression, this algorithm is for regression, while despite its name, Logistic Regression is not for regression but rather classification. If you haven’t had some intuition about Linear Regression, I would suggest reading about it first.
These 2 are very closely related, the difference of Logistic Regression is that it is packed with a late-coming function, and this function changes its continuous value to a value that can be used to derive class labels.
Linear Regression: 
Logistic Regression: 
( is the number of predictor variables).
We can see the function  is the only difference, the game-changer function that converges Linear to Logistic Regression, converges a regression algorithm to a classification algorithm.
So what exactly is that ? That function is called Logistic Function (another name is Sigmoid Function), it takes the form:

For any continuous input value of  , the output of
  is always a number in range (0, 1). We can visualize the function as below:

So then, if is in range (0, 0.5), the sample’s label will be classified as 0, while on the other hands, if is in range (0.5, 1), we predict the label is 1. If is exactly 0.5, we have no clue about the sample, we perceive it is equally likely to be 0 and 1.
For the first time when I encountered Logistic Regression, I was very curious about this Logistic Function. Why do we need it? For classification problems, we can just use Linear Regression and if the output is a negative number then we mark that sample’s label as 0, and the sample is marked as 1 if the output is positive, isn’t that more simple and straightforward?
This question can be further sliced into 2 parts: Why do we need a function to transform a real-and-continuous number into a value in the range (0, 1)?, and Among many functions that can do that transformation, why do we use the Logistic Function?
Let us answer these 2 questions one-by-one:
Firstly, for a (binary) classification problem, we should not let the output to be any real number, because:
- For example, if our Linear Regression output value of
 for a sample data point, it means the label is predicted to be 1. Well enough! But does that value of indicate strong confidence in the prediction? Or says, when the model outputs , how do we know whether it is very confident that the real label of the data point is 1, or it is just a little bit more than a random guess? As we have an unbounded range of the output, the returned value can be
  , or even
  , so how large the value should be to be called “confident” or “very confident”? We don’t know.
If we only care about the most likely label of the data points, this may not matter much, but in practice, it is often the opposite. We should not mark an email as spam if it is just 50.1% likely to be spam, nor should we predict a patient is having cancer-free without knowing the likeliness is high (99.99%) or just above 50%.
However, in some other cases, when we work with mass prediction, like choosing which ads to show to an individual, we don’t necessarily need to care much about the percentage anyway. Just give the customer the most suited ads and that is done. Thus, this first argument is not valid against those cases, yet the next one does.
Secondly, we have the question of: Why should we choose Logistic (or Sigmoid) Function over the others. To answer this in detail, we would have to dig a little bit in some mathematical transformations. I will not show those maths here, as this is just an introductory post, but to say about it at a high level, the Logistic Function, when being trained with Gradient Descent, turns out to give a very intuitive updating rule. In fact, the updating rule of Logistic Regression is the same as of Ordinary Linear Regression, that is, how we adjust the weight of the model is directly influenced by how much that weight contributes to the error term.
If you have read about Linear Regression, this rule should be very familiar:

Indeed, that is how we train Linear Regression, and that is also how we train Logistic Regression. Details about the way we derive this same updating rule for Logistic Regression will be given in the next post, so stay tuned!
| Test your understanding |
|
|
Wrapping up
I’m really glad you followed this blog post up to this place.
During the last minutes, we revised the definition of Logistic Regression, the relationship of it with Linear Regression, answer some questions about its existence and importance, along with some brief info about the training process and Gradient Descent.
Hope you enjoy reading this! Have a good day!
References: