Introduction
To date (April 2020), Android is still the most popular mobile operating system in the world. Taking into account billion of Android users worldwide, mining this data has the potential to reveal user behaviors and trends in the whole global scope.
This dataset is obtained from scraping Google Play Store. Without Google and Android, this dataset wouldn’t have existed. The scraping was done in April 2020.
Format
2 csv files:
- app.csv with 53,732 rows and 18 columns.
- comment.csv with 1,468,173 rows and 4 columns.
Download
Download from my public repository here.
Column description
App:
- id: a unique identifier for each app.
- app_name.
- genre (a.k.a category).
- rating.
- reviews: the number of reviews.
- cost_label: If the app is free, the cost_label value is ‘Install‘. If the app is premium, the cost_label value is the price, e.g. ‘đ23,000 Buy‘, ‘đ69,000 Buy‘. Note that the currency is in Vietnam dong. At the current time, đ23,000
 1$.
1$. - rate_5_pc, …, rate_1_pc: the percentage of user ratings that vote 5-stars, …, 1-star.
- updated: The date that the app was last updated on the Play Store.
- size: app size.
- installs: the number of installs (or downloads).
- current_version: the current version of the app.
- requires_android: the Android version required for the app to run.
- content_rating: age restriction.
- in_app_products: cost of items in the app.
- offered_by: the developer or team that designed the app.
Comment:
- app_id: the id of the app the comment belongs to.
- content: comment’s content, might be truncated if too long.
- stars: the user rating that is attached to the comment.
- helpfuls: the number of users who found this comment helpful.
Note that not all comments are recorded. Comments are sorted by relevance and at most 40 most relevant comments are recorded for each app.
Demonstrations
App ratings follow a left-skew distribution with the peak at rating 4.4. Very few apps are rated less than 3 overall.

Despite of the high ratings, many users take criticism comments as more helpful. 1-star comments get upvoted for 6 million times, which is much higher than any other except 5-star ones.

Is a high rating warranty of getting more installations?

Here is how to read this figure:
- Each circle represents the percentage of apps in the corresponding grid over all apps in that rating. For example, the size of the circle at position (rating=4, Installs=1M) is proportional to
 .
.
From the figure, we see that there seems to be a positive correlation between rating and the number of installs, however, this relationship is weak.
Take a look from another point of view, is rating affected by app category?
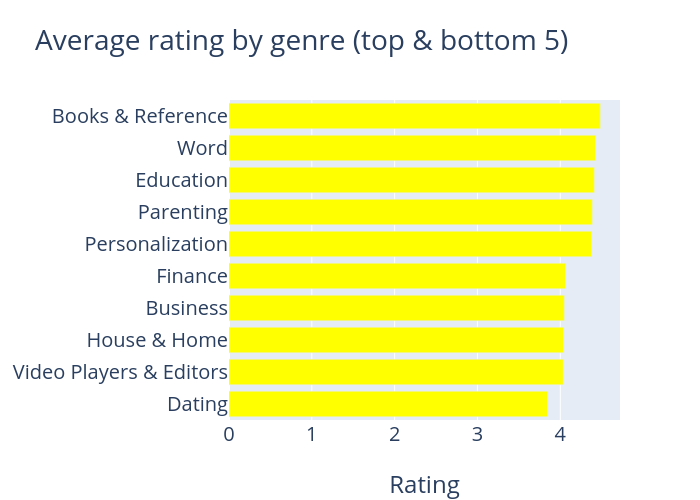
Dating is the only genre that has an average rating below 4, approximately 3.8, which is significantly lower than the next one. On the other side, education-related apps (book & reference, word, education) top the chart with impressive ratings from 4.4 to 4.5.
Lastly, let’s see at how the words are distributed in praises (5-star comments) and criticism (1-star comments):

Hi, this is great! Did you not capture the review posting date?
Hi Suvadip,
Sadly, I didn’t. Now when you say it, I realize I should have done it.
What about apps required permissions? really interesting in order to advance user privacy researches!
Hi Joe,
That is a good idea. Do you know where we can collect that data?