
In statistics and data mining, we often encounter the word ‘control‘, mostly from terms like control variables and control groups. In fact, a control variable has slightly different meanings in different fields, from scientific experimentation to observational analysis.
| Test your knowledge |
|
|
In Scientific Experimentation
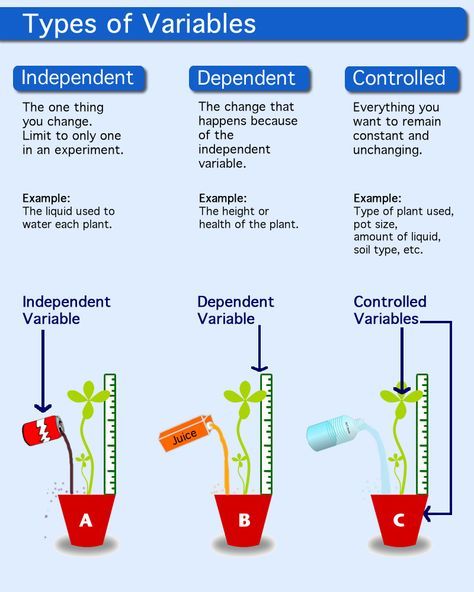
In scientific experiments, a control variable is an element that is kept constant throughout the course of the investigation. The control variables are not of primary interest of the researcher. By being a constant, a control variable does not have any impact on the dependent variable, thus giving room to other variables, the variables of interest, to affect the dependent variable and be examined by the researcher.
If instead, the control variables are not held constant, they could influence the experimental results and misleads researchers to make falsify conclusions about the variables of their interest.
For example, in Deep Learning, the activation functions seem to play a role in the performance of a network. Some of the most famous activations are Sigmoid, Tanh and ReLU. As we are building a Convolutional Neural Network for a Computer Vision task, we decide to conduct an experiment to determine which activation is most suitable for our problem.
That said, we build a network with, say, 20 convolutional layers, attached with BatchNorm, Dropout, etc. Then, we clone this network to 3 versions, each is different from the others only by the activation in use, all other properties (number of layers, BatchNorm configuration, Dropout configuration, etc) are kept the same. Finally, we train and test the 3 networks on our data to see the performance of each activation function. The fact that we keep everything the same for the 3 networks, except for the activation in use, allows us to verify the effectiveness of each of these activations.
In this example, the number of layers, the BatchNorm, the Dropout, and the input data are all control variables that are held constant so that our variable of interest, the activation function, is clearly examined.
On the other hand, we also have the term control group, which is a group of subjects who are not receiving treatment, this group is used as a benchmark to assess how the other groups (the experimental groups) perform.
For example, to test whether receiving more compliments will make the employees more productive, we randomly split the test subjects (the employees) into 2 groups. For the first group, the manager is instructed to praise and encourage each of them more frequently. For the second group, things are kept the same as usual. After 3 months, the performance of each test subject is measured and the average of the 2 groups are compared with each other to see if giving more compliments does have a good impact on productivity or not.
In this example, the second group is the control group, which acts as a benchmark to measure the first group, which is the group of interest.

In Observational Analysis
In regression analysis, or to be more specific, in observational analysis, a control variable corresponds to an independent variable that is added to the data to eliminate its potential to be a confounder that ruins the analysis of other independent variables of interest.
Let us make this clear from scratch.
A confounder (i.e. a confounding variable) is a variable that has causal effects on both the independent and dependent variables. For example, as the number of ice cream sales is highly correlated with the number of drowning cases, we may think that ice cream causes drowning. (To be clear-cut, in this problem, the number of ice cream is the independent variable and the number of drowning is the dependent variable.) However, it turns out that there is another factor that causes both these variables, which is the temperature (the confounder). The higher the temperature, the more likely people tend to eat ice cream, also the more people prefer to go swimming and then being drowned.

Thus, if we want to examine the role of ice cream in making people drowned, the temperature should be added to the dataset as an independent variable as well. The dataset somehow looks like this:
| City ID | No. ice cream sales | Temperature (°C) | No. drowning cases |
|---|---|---|---|
| A | 5210 | 27 | 2 |
| B | 8420 | 30 | 4 |
| C | 6320 | 26 | 3 |
| D | 1240 | 14 | 0 |
| … | … | … | … |
After collecting the dataset, we standardize it and make a regression to obtain the standardized beta coefficients that show how each of the independent variables impacts the dependent variable. For instance, we train an OLS and get:
Drowning cases = No. ice cream sales * 0.0000025 + Temperature * 2 – 10
This shows that Ice cream seems to have little (if not no) effect, while the Temperature does have some significant influence on drowning (each rising of 1°C makes 2 more people die in water).
However, if in the beginning, we did not include the Temperature in our dataset, the OLS might result in something like
Drowning cases = No. ice cream sales * 0.0006 – 1.5
which falsely indicates much more emphasis on the number of ice cream sales as a reason for drowning.
In conclusion, the temperature, although is not of our interest (our interest is to measure how ice cream results in drowning), still be added to the dataset because if it is not added, the fact that it is a potential confounder to our variables of interest (ice cream and drowning) may make our analysis fraudulent. The temperature, in this case, is a control variable.
Conclusion
In this article, we elaborated on control variables and control groups in scientific experimentation and observational analysis. In these situations, the term control often means not of interest, that they are there just to help researchers analyze the effect of other variables/groups.
| Test your understanding |
|
|
References:
- Wiki’s page about Controlling for a variable: link
- Wiki’s page about Control variables in the scientific experimentation: link
- Wiki’s page about Confounding: link
- Statisticshowto’s explanation of standardized beta coefficients: link
- Quora’s question about the control variable in regression analysis: link