
| Test your knowledge |
|
|
As we stated in the previous discussion, the ROC curve seems to be not a good evaluation metric when the data is highly imbalanced in favor of the Negative class. In this blog post, we introduce an alternative for the ROC: the Precision-Recall curve (PR-curve), which is a more reliable measurement for the cases when Positive samples are rare.
Definition
Being the same as the other curves, the Precision-Recall is simply a line graph showing the performance of a predictive model over a dataset. Although curves can be utilized for multi-class classification problems, they are most useful and comprehensive with binary labels, thus, we are going with this assumption (of binary labels) in this discussion.
A Precision-Recall curve differentiates itself from the others by its choice of the 2 axes, being the Precision and Recall rates, as literally implied by its name.
Precision and Recall are two measures computed from the Confusion Matrix, by:


Note that Recall is just another name of the True Positive Rate we used in the ROC curve.
To draw a Precision-Recall curve in Python, we can utilize a pre-built function from sklearn:
import matplotlib.pyplot as plt
from sklearn import metrics

precision, recall, thresholds = metrics.precision_recall_curve(y_true, y_pred)
plt.plot(recall, precision)
plt.show()
To get the Area Under the PR-curve, there are 2 ways: to approximate using the trapezoidal approximation formula or using the average precision score.
# method 1
precision, recall, thresholds = metrics.precision_recall_curve(y_true, y_pred)
metrics.auc(recall, precision)

# method 2
metrics.average_precision_score(y_true, y_pred)
Properties
At the first impression, we may take it that the PR-curve concerns more about the Positive class than the Negative one, as both the numerators of Precision and Recall are the count of True Positives. This preference is then proved to be useful in cases of datasets with a minority of Positive labels.
To illustrate, let us compare PR-curves on balanced and imbalanced datasets.
In the balanced one, the Positive samples take up 50% of the whole, while this number is 10% for the imbalanced dataset. For each test case, we will draw 4 PR-curves representing the performance of 4 classifiers, from Random, Moderate, Good to Perfect classifier.
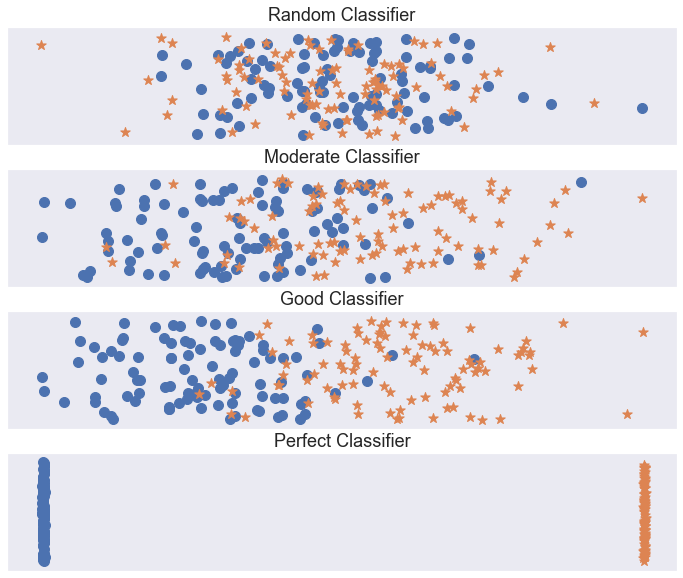
And here are the resulting curves:

Firstly, we can see that the random classifier is represented by a horizontal line with its y-axis value equals the proportion of Positive samples. This is right because the Precision is supposed to be a constant irrespective of the fluctuation in Recall.
Secondly, except for the perfect classifier who is always a straight, superb line, the other ones are different for each type of datasets. More specifically, with the same distribution of predictions, the PR-curve shows a worse performance when the proportion of Positive samples is lower.
Why this is the case? Let’s look at the below for easier intuition:
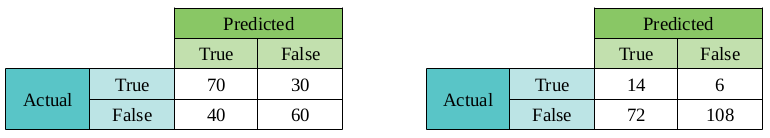
These are the prediction tables of a classifier on 2 datasets, the first one with 50% Positive and the second one with only 10% Positive (similar to our example above). While the True Positive Rate (Recall) and the True Negative Rate remains the same, the Precision shifts terribly.


This utterly makes sense, since, for the imbalanced dataset, only 14 of the 86 predicted Positive samples are actually true, which implies a bad classifier. This indication, however, is failed to be captured by most other types of curves (e.g. the ROC-curve).
Goods and bads
The PR-curve is sensitive to data distribution. Furthermore, it cares about the Positive cases more than the Negatives, which makes it suitable for datasets with a small fraction of Positive samples.
The base-line performance (i.e. performance of a random classifier) in the PR-curve is expressed by a horizontal line with  (thus the Area Under this PR-curve is also
  ), which is different for different datasets. This makes the comparison between datasets harder.
More general advantages and disadvantages of using a curve for evaluating model performance are given in this post.
| Test your understanding |
|
|
References: