
| Test your knowledge |
|
|
Linear Regression (LR) can be applied to solve any regression problem. We can just transform all predictor variables into numerical form, and then call a simple sklearn function on Python to run the LR.
But, in which cases does Linear Regression perform the best? In which cases should we use other algorithms?
To answer these questions, we need to look at the Assumptions of Linear regression. If all the assumptions hold, your Linear regression model will express its max potential power, and probably be the best algorithm that should be applied to your problem.
Though it is usually rare to have all these assumptions hold true, LR can also work pretty well in most cases when some are violated.
To begin with, I will separate the assumptions into 2 types: pre-model assumptions and post-model assumptions.
Pre-model Assumptions are the assumptions for the data, the problem. We can test if these assumptions hold true before we fit a linear regression model to the data. These assumptions affect our decision on whether or not should we use linear regression on this problem.
Post-model Assumptions: are the assumptions of the result given after we fit a linear regression model to the data. Violation of these assumptions indicates that there is something wrong with our model.
No more words needed, let’s go straight to the 5 Assumptions of Linear Regression:
1. Linear and Additive relationship between each predictor and the target variable
This is a pre-model assumption.
Definition
The first and obvious assumption of Linear regression is linearity. By its nature, LR assumes that each predictor variable adds a linear amount of value to predict the target, and the result should be the sum of all these values.
A glance at LR’s function will clear this point:
 .
.
How to test?
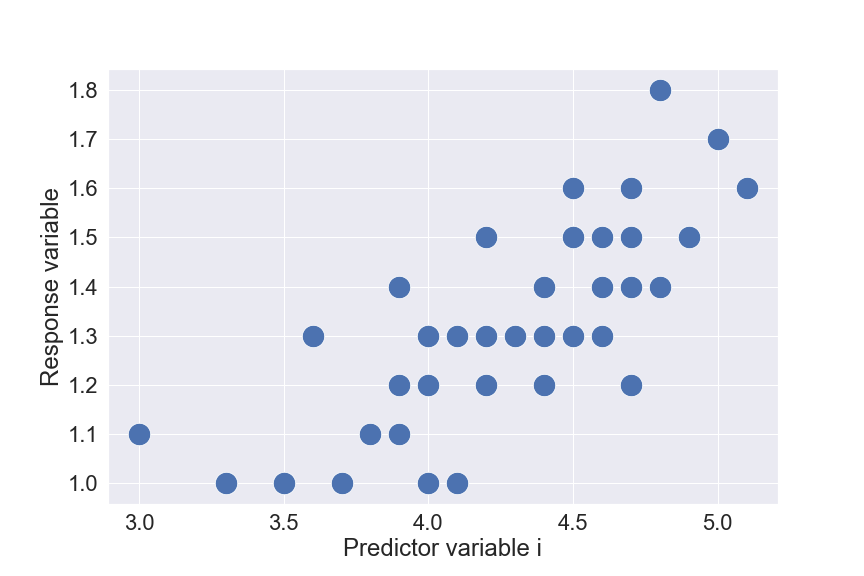
Scatter plots between each predictor variable and the response variable can help. If the set of points has its tendency to form a line, that would be a good signal of linearity. The below plot is an example.
And how to check for the additive property? You can also use scatter plots, with 1 axis still being Response variable, while the other is a combination (addition) of some predictor variables. In fact, this step is often skipped because the time required is tedious and the linearity condition is usually strong enough to cover this assumption.
2. Little or no Multicollinearity
This is a pre-model assumption.
Definition
Multicollinearity is the phenomenon when a predictor variable has a correlation with a linear combination of 1 or more other predictor variables.
Having high Multicollinearity in the dataset actually does not lower the performance of Linear Regression models, but makes the model’s weights unstable. Thus, we may give a false conclusion about the importance of each predictor. You can read more about this in my blog about Multicollinearity.
How to test?
Calculating the correlation coefficient of each pair of predictors should give an overview of multicollinearity status in your dataset.
To get a comprehensive view, you may consider computing the Variance Inflation Factor (VIF).
3. Little or no Auto-correlation in the residuals
This is a post-model assumption.
Definition
This assumption holds if and only if the residual of each sample is independent of other sample’s residuals.
Time series data is a typical case of violating this assumption. For example, a hedge-fund consistently predicts stock price somehow higher than what it truly be in the Spring, but usually predicts stock price a little bit lower than ground true in the Summer. If there seems to be something systematic in the errors of prediction, then there is Auto-correlation.
Auto-correlation exists means we have missed something in our model, and we are having chances to increase our model’s performance by finding out and making use of that ‘something’.
How to test?
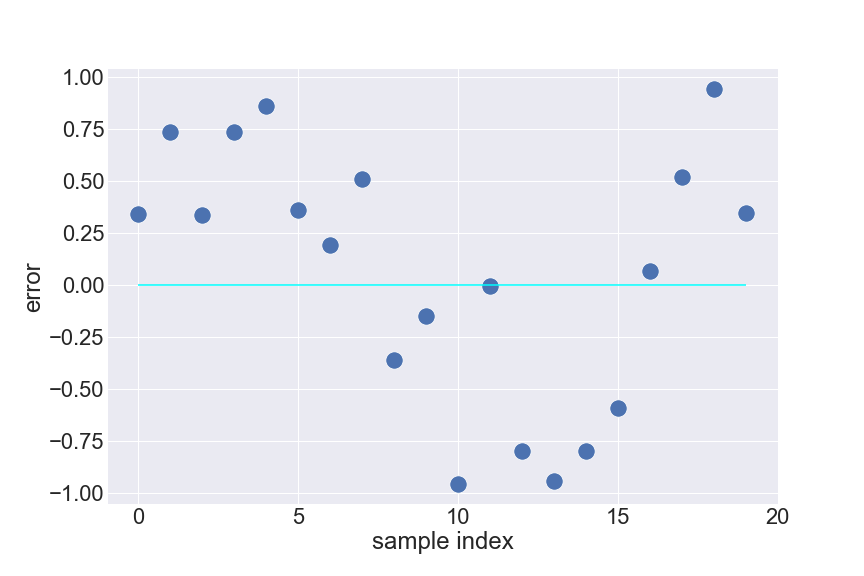
Scatter plots can also work well to detect Auto-correlation.
Durbin Watson test is another option to measure first-order Auto-correlation quantitatively.
4. Normal distribution of Error term
This is a post-model assumption.
Definition
The distribution of error must be normal.
This assumption is not only applied to Linear regression, but also other algorithms. As we already know, Machine learning models’ performance may be high or low, but it is really unrealistic to be perfect. No matter how good our model is, we always expect some errors in our predictions. That is because there should always exist some unknown, unpredictable error. This error may come from various sources, e.g. mistakes when recording data, computer errors, numerical errors, the randomization method when sampling and splitting data, the pre-processing phase, biases in doing experiments, etc. Each source of error follows its own distribution. And according to Central Limit Theorem, when we combine various distributions, we will have a normal distribution.
That is why we expect a normal distribution in the error term. Hence, if our error does not seem like normal, there should be something that we can capture but have not.
How to test?
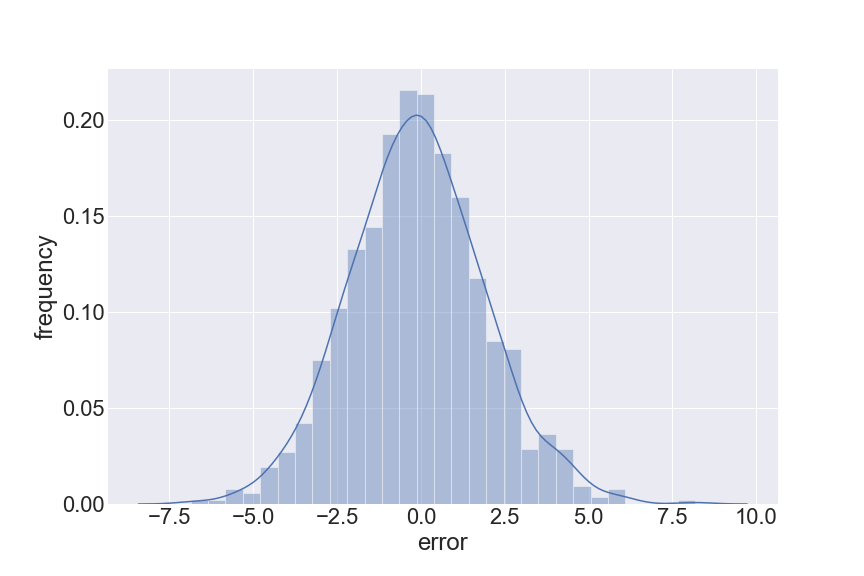
The simplest (but not comprehensive) way to test for normality is to plot a histogram. A Q-Q plot is even better.
We can also examine skewness and kurtosis to quantitatively scan for non-normality.
5. The error must have constant variance
This is a post-model assumption.
Definition
This assumption refers to the consistency of error’s variance irrespective of anything. Here, “anything” often means predictor variables and predicted values. That is, for example, you select 1 predictor variable v and divide your dataset into 2 groups, the first group with all samples that have small v and the second group with all samples that have large v. If the error variances of these 2 groups are different, then this assumption is violated.
The usual case of violating this assumption is when error’s variance increases proportionally to the value of the predicted response. For example, when predicting house prices. A house with a true value 2000$ is as likely to be predicted 3000$ as a house with a true value 20000$ being predicted 30000$.
A method to resolve this issue is to apply a logarithm to the response variable (or any predictor variable that violates this assumption).
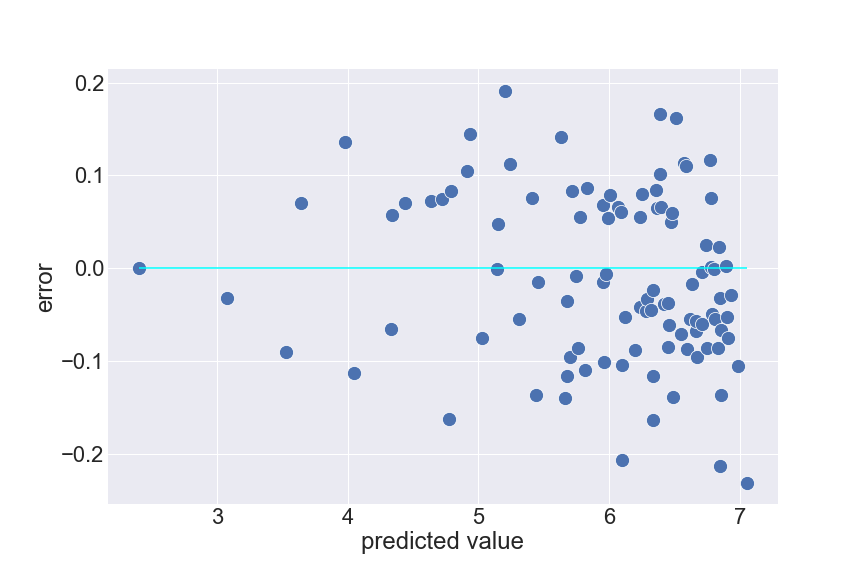
How to test?
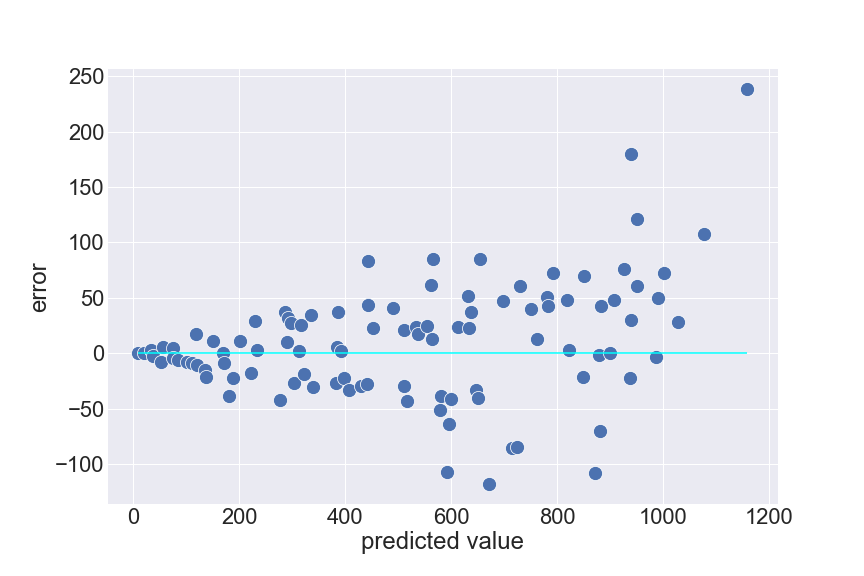
We can just draw a scatter plot like above, while an axis represents predicted value and the other is the corresponding error. The points should make a shape similar to a rectangle if the variance is constant. For non-constant error variance cases, the shape usually looks like a funnel.
Some other tests are the Breusch–Pagan test, Goldfeld–Quandt test, etc.
| Test your understanding |
|
|
Summary
We just went through the 5 golden assumptions of Linear regression, they are:
You can find the full series of blogs on Linear regression here.
References: