
| Test your knowledge |
|
|
Just like other parametric algorithms, Logistic Regression also has some requirements about the problem, the data and about itself. When these requirements, or assumptions, hold true, we know that our Logistic model has expressed the best performance it can.
If you have read the blog about Linear Regression’s assumptions, you should be familiar with the 2 types of assumptions: pre-model assumption and post-model assumption.
Pre-model Assumptions are the assumptions for the data, the problem. We can test if these assumptions hold true before we fit a model to the data. These assumptions affect our decision on whether or not should we use Logistic Regression on this problem.
Post-model Assumptions are the assumptions of the result given after we fit a Logistic Regression model to the data. Violation of these assumptions indicates that there is something wrong with our model.
As Logistic Regression is very similar to Linear Regression, you would see there is closeness in their assumptions as well.
1. Little or no Multicollinearity
This is a pre-model assumption.
Definition
Multicollinearity is the phenomenon when a predictor variable has a correlation with a linear combination of 1 or more other predictor variables.
Having high Multicollinearity in the dataset actually does not lower the performance of Logistic Regression models, but makes the model’s weights unstable. Thus, we may give a false conclusion about the importance of each predictor. You can read more about this in my blog about Multicollinearity.
How to test?
Calculating the correlation coefficient of each pair of predictors should give an overview of multicollinearity status in your dataset.
To get a comprehensive view, you may consider computing the Variance Inflation Factor (VIF).
2. Sample Independence
This is a pre-model assumption.
Definition
All the sample points should be independent and separated from each other. Remember that by using Maximum Likelihood as the objective function, we assume all samples are independent. If sample data is correlated (e.g. one data point appears 2 times in the dataset, a faulty experiment environment causes similar biases to the data points), there will be systematic errors in the data, which then ruins the model.
How to test?
The duplication fault is quite easy to catch with sorting your data points and compare every pair of consecutive samples.
The problem with an erroneous experiment environment is more tricky. Identifying this kind of issue often requires an in-depth exploratory analysis to spot the inconsistencies in the data. Good domain knowledge also plays a vital role in finding the profound flaws that are hidden deep inside.
3. No big influentials
This is a pre-model assumption.
Definition
Logistic Regression is not famous for its strength against rebellious data. In fact, like Linear Regression, Logistic Regression also has a fear of outliers. With just 1 big-influential in our data, our model can suffer, as demonstrated in the below example.
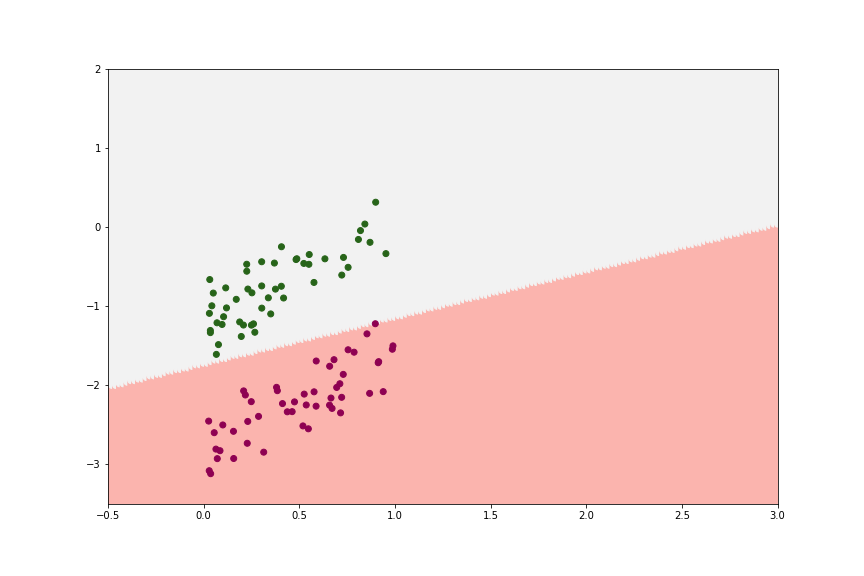
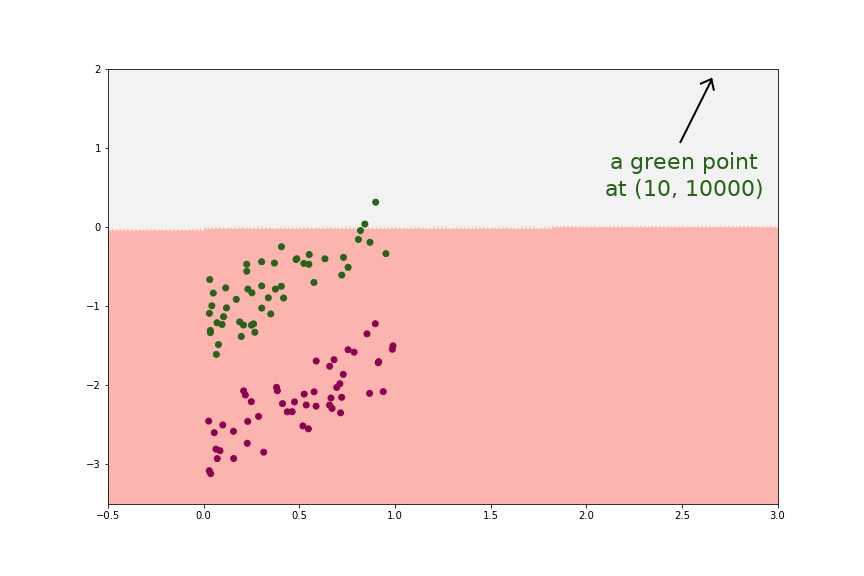
How to test?
We can easily spot these mischievous data points if there are only 1 or 2 predictor variables. If the number of predictor variables is large, anomaly detection techniques should be in demand.
4. Linearity in the logit
This is a post-model assumption.
Definition
While Linear Regression assumes a linear relationship between each predictor variable and the response variable, Logistic Regression also assumes a linear relationship, but in the logit. You may be wondering what logit is. Remember the formula of Logistic Regression:

 is called the logit function. Above transformations showed that Logistic Regression assumes the predictor variables have linear relationship with the logit of the response variable (in other words,
  has linear relationship with
  for
for  , where m is the number of predictor variables).
How to test?
For each of the predictor variables, we can draw a scatter plot versus the logit of predicted value  . If the points arrange to nearly a straight line, the linearity assumption seems to hold.
If some of the plots do not show straight lines (maybe curves or zig-zag), we may consider transforming the variables if possible, e.g. to high orders or applying spline function.
* A note on the data
This is not a formal assumption, but still worth taking seriously when working with Logistic Regression. Logistic models usually require a large sample size. A guideline for the minimum data needed is 10 data points for each predictor variable with the least frequent outcome.
For example, in our data, there is 70% of data points belonging to the positive outcome, while 30% of the negative outcome. The number of predictors m = 12. Then, the minimum number of samples we should have is:

On the other hand, be reminded that the more the number of samples for positive class and negative class close to each other, the better. It would be best if this proportion is 50:50. To achieve this, we may need to apply some techniques to balance unbalanced datasets.
| Test your understanding |
|
|
References:
- Stoltzfus’s Logistic Regression: A brief Primer: link