
| Test your knowledge |
|
|
Z-score is a very frequently used term from statistics being applied in Machine Learning. In this blog, we discuss what those Z- (Z-score, Z-statistic, etc.) are and how to make use of them.
Let’s start!
The easiest goes first. It helps to make it clear that:
Well, good enough! From the 4 terms in the title of this post, now we remain with only Z-score and Z-test.
Z-score
Assume we have a Normal distribution with mean  and standard deviation
  (called std or sigma).
We take a data point from this distribution, let’s call the value taken is x. Then:
The z-score of x represents the direction and distance from  to x, with unit
  .
.
For example, suppose we have a Normal distribution with = 2 and = 5. The sample data point we take has value x = 9.5 .
To calculate Z-score of x, first, we subtract from x (i.e. x – ) to get the distance (with sign) from to x. A positive value indicates that x is on the right of , while a negative one infers that x is on the left of . Then, we divide the result by to have as the unit of our distance.
Thus,

This means that x is 1.5 larger than .
The official formula for Z-score is:

Remember that the unit of Z-score is , and Z-score is negative if  .
.
So what is Z-score for?
We know that Z-score infers how the value of x is compared to its distribution’s mean , but so what? why do we need Z-score?
To answer, Z-score is a medium, which we use to compute a more insightful value: the likelihood of getting x.
Let’s get through the concept with an example. From various studies and experiments, the scientists make a conclusion that human IQ is normally distributed with = 100 and = 15. Today, you took an IQ Test and your result is 125. You are so happy that you are more intelligent than the average but also curious about how you are compared to the others in more detail. Are you smarter than just 51% of the human community, or are you in the top 1%?
To answer this question, we should first calculate the Z-score of your IQ-test:

And here is the interesting fact:
the Z-score is also normally distributed with = 0 and = 1.

As per the normal curve above, the shaded region represents the percentage of people with lower or equal IQ to yours. And it is  95.2%, which means you are on the top 4.8% of the world on IQ.
The number of 95.2% is taken from the cumulative distribution function (CDF) of a unit normal distribution (the normal distribution with = 0 and = 1), given your Z-score (1.67).
In Python, we can query the percentile of your Z-score using the cdf function from scipy:
scipy.stats.norm.cdf(1.67)
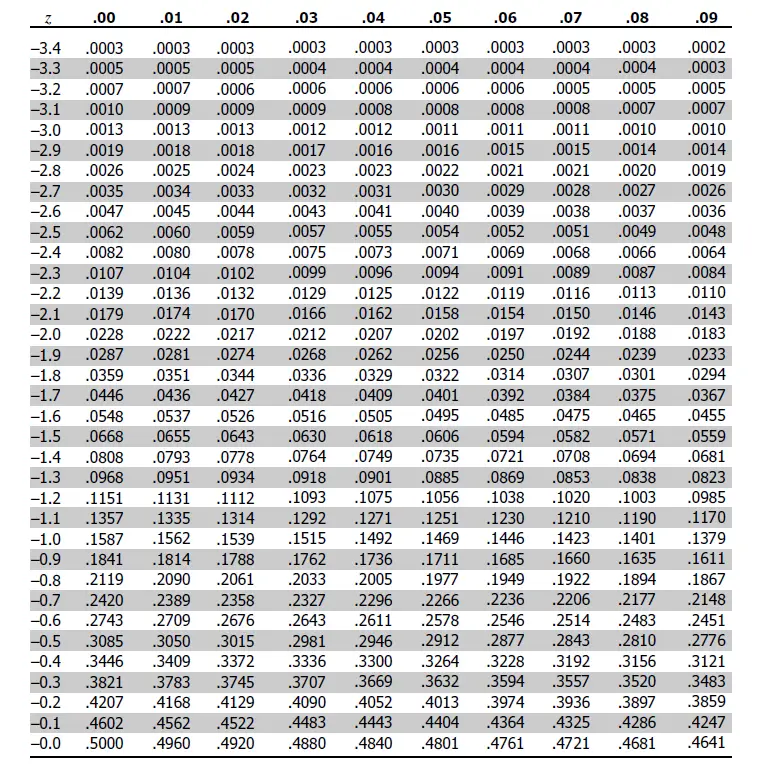
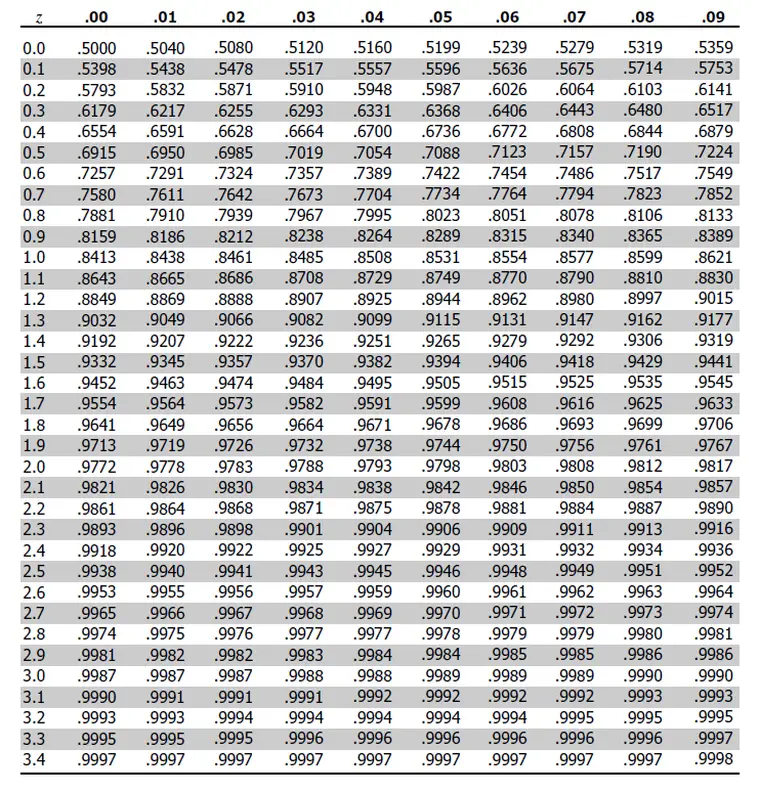
Or, if don’t want to involve any programming, we can instead check a Z-table:
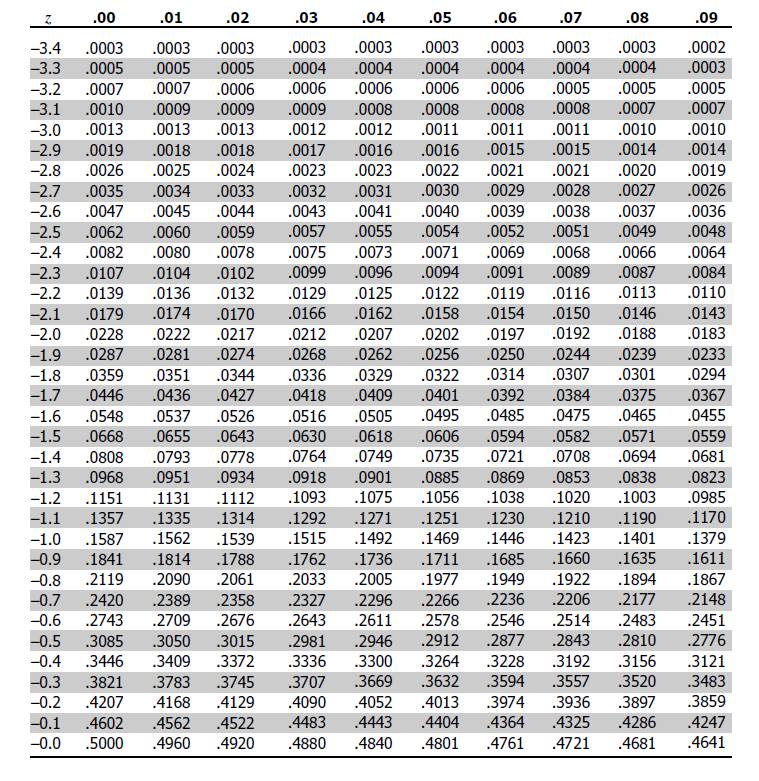

To query the Z-table, for example, for z-score = 1.67, we find the row with value 1.6 and the column with value .07 (since 1.67 = 1.6 + .07). The table value at the intersection cell is our percentile (0.9525 in this case, which equals 95.25%). This Z-table is just a shorthand for a quick lookup of Z-score without a calculator or computer.
Another practical use of the Z-score is on medical reports. Today, a Bone Density result should usually contain a z-score. This z-score compares your bone density with others who are around your age and of the same gender.
Z-test
Z-test is a type of hypothesis testing, where the test statistic is normally distributed (or say, where the test statistic follows a Z-distribution).
Above, we tried to find your IQ percentile, which is effectively a Z-test, because the result (or the z-score) follows a normal distribution.
In the subsequent blog posts, we will also introduce T-test and F-test. The Z-, or T-, or F- here all infer the distribution of the test result, Z-distribution, T-distribution or F-distribution.
| Test your understanding |
|
|
Conclusion
In this blog, we make acquaintance with the family of Z-, including:
Z-score is the number of sigmas () our data point is away from the mean (), being negative, zero or positive.
Z-statistic is the same as Z-score.
Z-distribution is the same as Normal distribution.
Z-table is a pre-computed table to lookup the percentile of our z-score.
Z-test is the hypothesis test that the result (test statistic) follows Z-distribution.
References:
A nice writing. However, IMHO, we should not use sample in this context: “We take a sample from this distribution, let’s call the value taken is x”. A raw score, data point, … are likely more suitable.
Sample means a subgroup of a population (distribution), other than a single data point.
Regards.
Thanks for your suggestion.
Indeed, as I used to use the word sample to indicate one sample data point, this does not conform to the norm and might make readers confused about the subject. I re-checked and fixed it. Please let me know if there are any other issues.
Bests,